Topographic maps represent one of humanity’s most powerful tools for understanding the physical world. Long before satellites and digital elevation models, people needed ways to record hills, valleys, rivers, and mountains on flat surfaces. The evolution of 2D topographic maps is the story of how humans learned to translate three-dimensional landscapes into readable, standardized visual systems. This evolution did not happen overnight. It unfolded over centuries through experimentation, mathematics, surveying, and a growing desire to explore, govern, and understand land with precision.
Ancient Beginnings: Early Attempts to Capture Terrain
The earliest maps were not topographic in the modern sense, but they laid the groundwork for what would come later. Ancient civilizations such as the Babylonians, Egyptians, and Greeks produced maps that focused on boundaries, routes, and landmarks rather than elevation. Terrain was often implied symbolically, with mountains drawn as pictorial icons and rivers shown as simple lines. These early representations prioritized storytelling and navigation over measurement, yet they revealed an early awareness that landforms mattered. Greek scholars introduced mathematical thinking into cartography, using geometry to describe space, but true elevation-based mapping remained out of reach due to limited surveying tools.
The Medieval Shift: Relief Drawings and Perspective
During the Middle Ages, maps evolved stylistically rather than scientifically. Cartographers began experimenting with relief drawings, shading, and perspective to suggest terrain height. Mountains were often illustrated as rows of overlapping peaks, giving the impression of elevation without measurable accuracy. These maps were visually expressive but inconsistent, relying heavily on artistic interpretation. While unsuitable for precise navigation, they marked an important conceptual step toward representing vertical space on a flat surface. The idea that height and slope could be communicated visually was becoming more accepted, even if not yet standardized.
The Scientific Awakening: Measurement Enters the Map
The Renaissance ushered in a dramatic shift in cartography. Advances in mathematics, astronomy, and surveying introduced accuracy and repeatability into mapmaking. Surveyors began measuring angles, distances, and relative elevations using tools like theodolites and leveling instruments. Instead of drawing mountains as symbols, cartographers sought ways to represent actual terrain shape. Hachures emerged as one of the earliest systematic methods, using short lines to show slope direction and steepness. Though imperfect, hachures allowed readers to infer terrain form and marked the beginning of quantitative topographic representation.
Contour Lines: The Breakthrough That Defined Topography
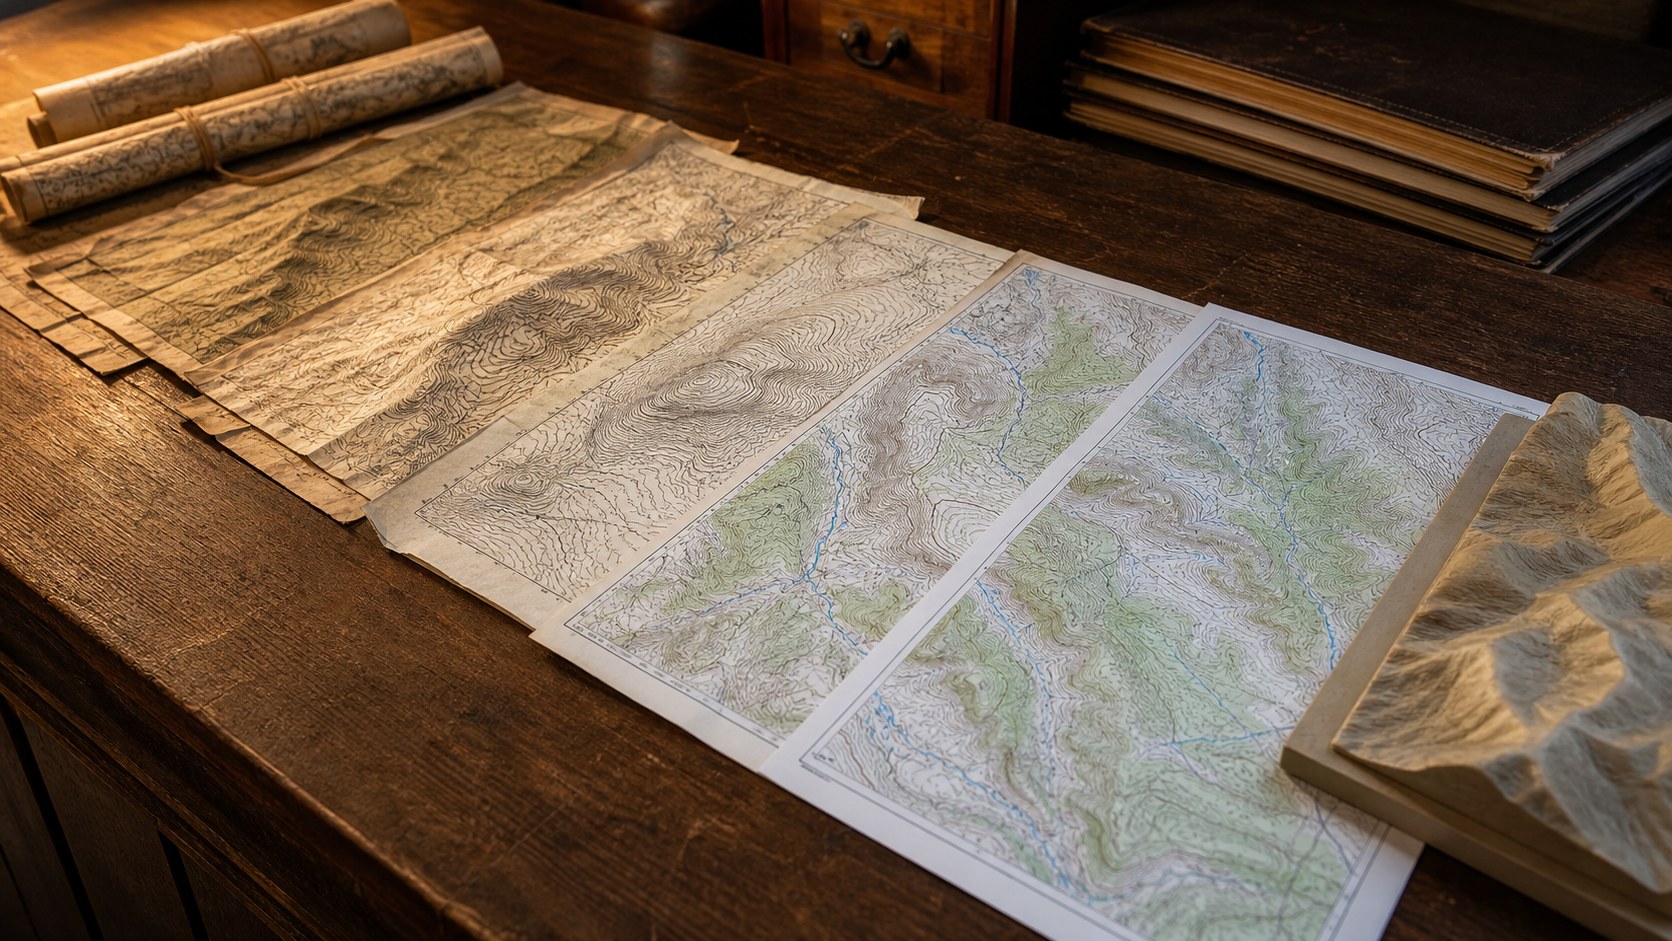
The introduction of contour lines in the late eighteenth and early nineteenth centuries revolutionized topographic mapping. Contour lines connect points of equal elevation, allowing the entire shape of the land to be represented with mathematical consistency. For the first time, readers could visualize hills, valleys, ridges, and depressions accurately by interpreting line spacing and patterns. This innovation transformed maps from artistic approximations into analytical tools. Contour mapping spread rapidly across Europe and North America, becoming the foundation of modern topographic cartography and enabling reliable navigation, engineering, and land planning.
National Mapping and Standardization
As governments recognized the strategic and economic value of accurate maps, national mapping agencies emerged. Large-scale surveying projects standardized symbols, contour intervals, and map scales, ensuring consistency across regions. In the United States, organizations like the United States Geological Survey played a central role in producing detailed topographic maps that covered vast areas with uniform conventions. These efforts made topographic maps accessible to scientists, engineers, military planners, and the public, cementing their role as authoritative representations of the landscape.
Printing, Color, and the Rise of Visual Clarity
Advances in printing technology further refined 2D topographic maps. The introduction of color allowed cartographers to distinguish water features, vegetation, urban areas, and elevation zones more clearly. Shaded relief techniques were sometimes layered beneath contour lines to enhance visual comprehension without sacrificing accuracy. These improvements made maps easier to read and more intuitive, especially for non-specialists. By the mid-twentieth century, topographic maps had reached a level of clarity and reliability that supported everything from wilderness navigation to major infrastructure development.
The Enduring Power of Flat Maps in a Digital World
Even as digital mapping and 3D visualization tools emerged, 2D topographic maps retained their relevance. Their strength lies in abstraction, stripping complex terrain down to essential information that can be read quickly and universally. Modern digital tools still rely on the same principles developed over centuries, with contour lines and elevation data forming the backbone of digital terrain models. The evolution of 2D topographic maps is not a story of obsolescence, but of refinement. These maps remain a testament to human ingenuity, proving that a flat surface, when designed with care and precision, can faithfully represent the complexity of the natural world.


