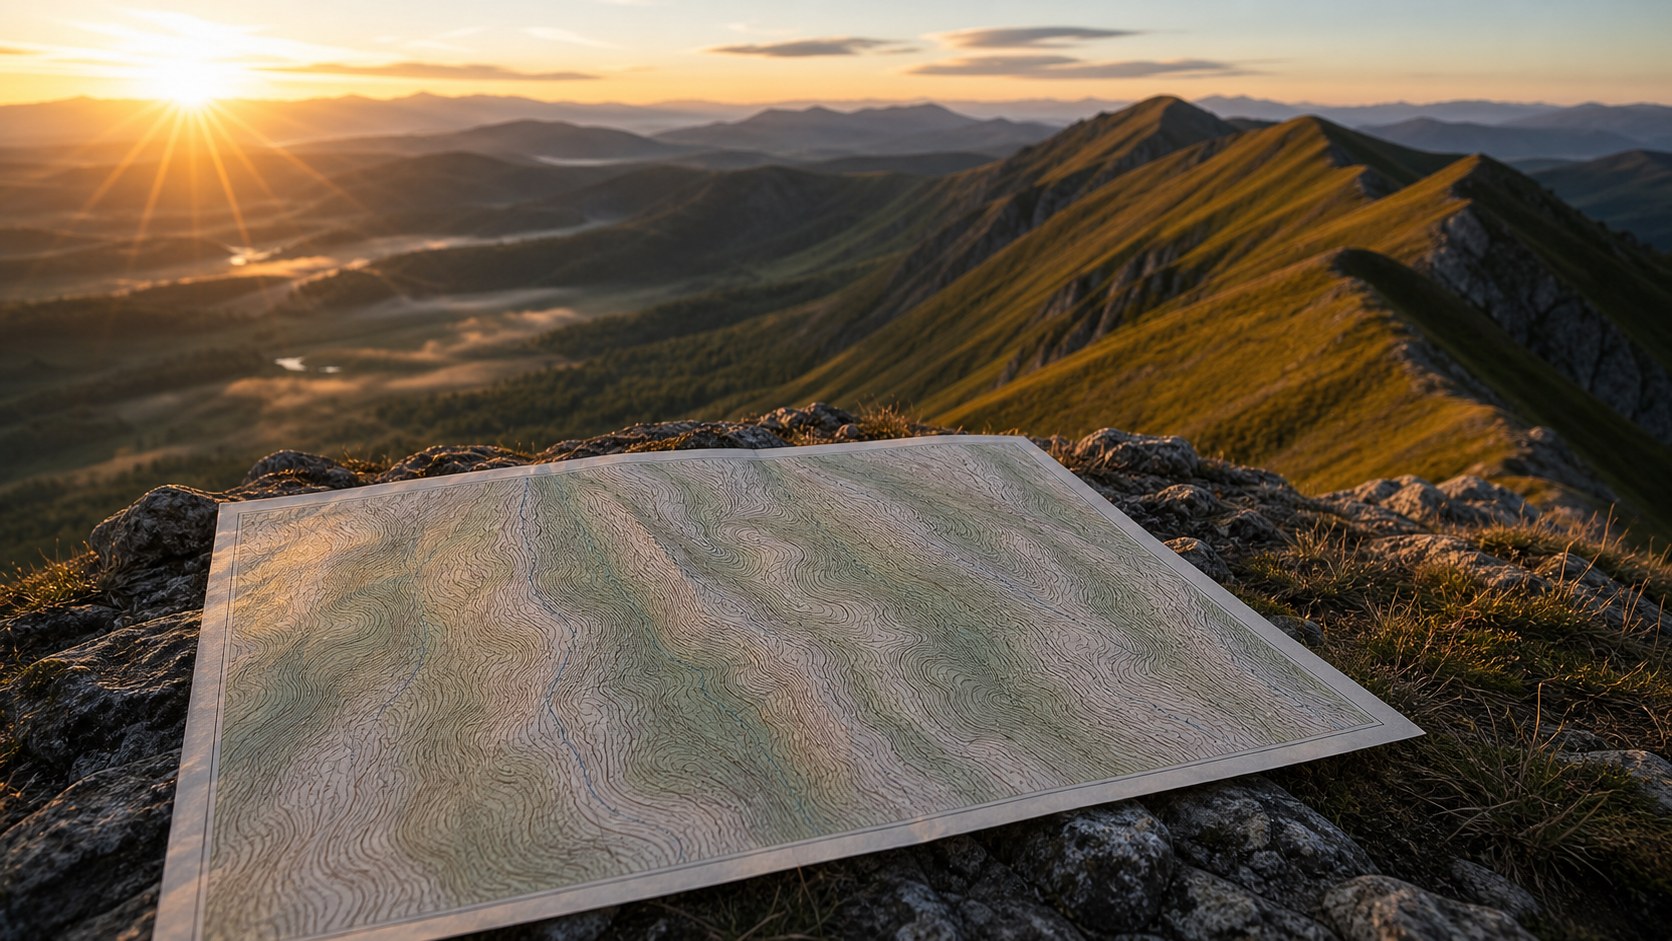
Topographic maps present a tapestry of curving lines that, at first glance, may seem like an intricate maze. Yet these contour lines are much more—they are the storytellers of the landscape, whispering secrets about elevation, slope, and the very shape of the Earth beneath your feet. By learning to interpret contour lines, you transform a flat sheet of paper into a vivid portrait of hills, valleys, ridges, and plateaus. Whether you’re an intrepid hiker plotting a backcountry route, an engineer designing a hillside development, or simply fascinated by the natural world, mastering contour interpretation opens a window into the terrain’s hidden dimensions.
Grasping the Essentials of Contour Intervals
Every topographic map employs a vertical measurement called the contour interval, which dictates the elevation difference between successive lines. A map covering rugged mountains might use a larger interval—such as 100 feet or 50 meters—to prevent clutter, while maps of gently rolling plains often adopt finer intervals of 10 or 20 feet for greater detail. The contour interval appears in the map legend and should be the first datum you verify. With that single number, you can calculate the total elevation gain by counting the lines between two points. This simple subtraction empowers you to plan your energy expenditure on a hike or determine suitable slopes for construction projects.
Recognizing Landform Signatures in Line Patterns
Contour lines are not random curves; they form distinctive patterns that correspond to specific landforms. Concentric loops usually indicate hills or mountains, each inner loop climbing higher until the summit is reached. When those loops bear small tick marks pointing inward, you’ve identified a depression—a sinkhole, crater, or basin where water may pool. Ridges emerge as elongated loops stretching along a high point, while valleys display a V-shaped contour that points upstream toward higher ground. By internalizing these visual signatures, you develop the ability to “see” the terrain in advance, as if the map were a three-dimensional model in your hands.
Assessing Gradient and Slope with Precision
The spacing between contour lines holds the key to slope steepness. Wide gaps mean gentle inclines that might suit casual walkers, picnic spots, or easily graded roads. In contrast, tightly packed lines warn of steep cliffs or rugged ascents, where a helmet or climbing gear could be essential. For a more analytical approach, measure the horizontal distance on the map, factor in the contour interval, and compute the slope percentage—vertical change divided by horizontal distance, multiplied by 100. This calculation is invaluable for architects seeking optimal building sites, environmental scientists evaluating erosion risk, and land managers planning trail systems that minimize wear and tear on fragile ecosystems.
Anchoring Yourself with Index and Intermediate Contours
To simplify the maze of lines, cartographers differentiate between index contours and intermediate contours. Index contours are bolder, labeled with their elevation, and typically occur every fifth line or on a round-number elevation. These serve as elevation landmarks that anchor your understanding of the map’s vertical scale. Between them lie the intermediate contours, drawn with thinner lines and unlabeled, filling in the topographic detail. On some maps, you may also encounter supplementary contours—dashed or faint lines that indicate subtle rises or depressions smaller than the main interval. Recognizing these line styles accelerates your map-reading speed, allowing you to leapfrog from one index contour to another without missing crucial details.
Visualizing Elevation on the Ground
Translating contour lines into physical terrain begins by sketching an imaginary cross-section. Select two points on your map, draw a line connecting them, and then transpose each contour crossing onto a graph with elevation on the vertical axis and distance on the horizontal. The resulting elevation profile reveals climbs, descents, and flat stretches at a glance. Though digital mapping tools can automate this process, the manual method deepens your spatial intuition. You’ll no longer rely solely on numerical data; you’ll develop a keen sense for how a 500-foot rise feels, or how a gradual 2% incline compares to a sudden 25% grade.
Navigating Streams, Watersheds, and Drainage Patterns
Contour lines also chart the course of water. When you spot a V or U shape in the contours, the apex of the V points uphill, marking a valley where water flows. By tracing these V-shaped patterns, you can locate streams, predict seasonal drainage routes, and understand watershed boundaries. High points where contours form closed loops without hatch marks delineate ridgelines, which often serve as natural divides. Awareness of drainage networks is critical for hikers seeking water sources, civil engineers designing sustainable stormwater systems, and conservationists aiming to protect riparian habitats.
Charting Efficient and Safe Routes
Effective route planning on a topographic map means balancing distance with elevation change. “Contouring” around a hillside—following a single contour line as closely as possible—minimizes ascent and conserves energy. When an ascent is inevitable, study line spacing to choose the gentlest slope. In emergencies, contour interpretation can guide you toward accessible descent paths or safe camp spots on a level bench. For search and rescue teams, rapid contour analysis pinpoints likely travel corridors and potential hazards. By combining terrain visualization with navigational skills, you gain confidence to tackle unfamiliar landscapes.
Avoiding Misinterpretation: Pitfalls and Best Practices
Contour reading can sometimes mislead, particularly in complex geological settings. Overlapping features, such as terraced formations or tilted strata, may create optical illusions of nonexistent saddles or spurs. Always cross-reference contour patterns with map symbols for rock outcrops, cliffs, and vegetation boundaries. Pay attention to the map scale—misjudging distances can turn a supposed long stroll into an arduous expedition. Remember magnetic declination: align your compass readings with true north as indicated on the map to avoid directional errors. Cultivating these habits prevents missteps that could compromise safety or project accuracy.
Integrating Digital Tools with Traditional Maps
While paper topographic maps remain indispensable—immune to battery failure and often more detailed than their digital counterparts—modern mapping apps and GPS devices offer valuable enhancements. You can overlay satellite imagery, import waypoints, and dynamically generate elevation profiles in real time. Some apps even allow you to toggle contour intervals or highlight slope steepness with color gradients. However, never abandon fundamental map-reading skills; technology may falter, but your understanding of contour logic endures. Use digital tools to augment, not replace, the tactile engagement of studying lines on paper.
Exploring Specialized Contour Applications
Beyond outdoor navigation, contour interpretation plays a central role in diverse fields. Urban planners utilize contours to optimize drainage networks, prevent flood zones, and site new developments with minimal environmental impact. Agricultural engineers design terraced fields that match natural contours, reducing soil erosion and conserving water. Archaeologists identify buried structures by detecting subtle contour irregularities. Ecologists map wildlife corridors by analyzing elevation preferences of different species. Across disciplines, contour mastery transforms abstract elevation lines into actionable insights that shape sustainable solutions.
Cultivating a Deeper Connection to the Landscape
Interpreting contour lines fosters more than technical proficiency; it nurtures an intimate bond with the land. As you learn to read the script of elevation and form, you gain reverence for the geologic forces—erosion, uplift, glaciation—that sculpt the planet over millennia. Every summit, saddle, and valley becomes part of a grand narrative, connecting you to explorers, surveyors, and naturalists who first charted these contours. Whether you’re navigating a remote mountain pass or designing a garden that flows with the land, contour literacy enriches your experience and broadens your perspective.
Elevation Interpretation: An Ongoing Adventure
Mastery of contour lines is not a final destination but a continuous journey. Each map presents new challenges: a densely forested region where contours peek through tree symbols, a karst landscape riddled with sinkholes, or a coastal area where tidal flats flatten the contours. Embrace these variations as opportunities to refine your skills. Share your knowledge with fellow map enthusiasts, mentor newcomers on trailheads, or contribute to citizen-science mapping projects. In teaching and learning, you reinforce your own understanding and help cultivate a community of confident, terrain-savvy explorers.
Embracing the Elevation Journey
Contour lines may begin as abstract loops on a map, but with practice, they transform into lifelines that guide your adventures, inform your designs, and deepen your respect for the world’s contours. By honing your ability to interpret these lines—through interval analysis, pattern recognition, slope assessment, and both traditional and digital tools—you unlock a realm of geographic insight. Each map you study becomes more than a navigational aid; it becomes a witness to Earth’s dynamic history and a companion on your ongoing exploration of its heights and depths.